Survival analysis is a key statistical method in clinical research, used to analyze the time until an event of interest, such as death, relapse, or recovery. Unlike traditional methods, it can handle censored data, where the event has not occurred for some subjects by the study ’s end. A central tool in survival analysis is the Kaplan-Meier estimate, a non-parametric method for estimating the survival function. The survival function S(t) represents the probability that a subject will survive beyond time t :
\[ S\left(t\right)=\prod_{t_i\le t}\left(1-\frac{d_i}{n_i}\right) \]
where \( t_i \) denotes the time of the i-th event, \( d_i \) is the number of events at \( t_i \), and \( n_i \) is the number of individuals at risk just before \( t_i \).
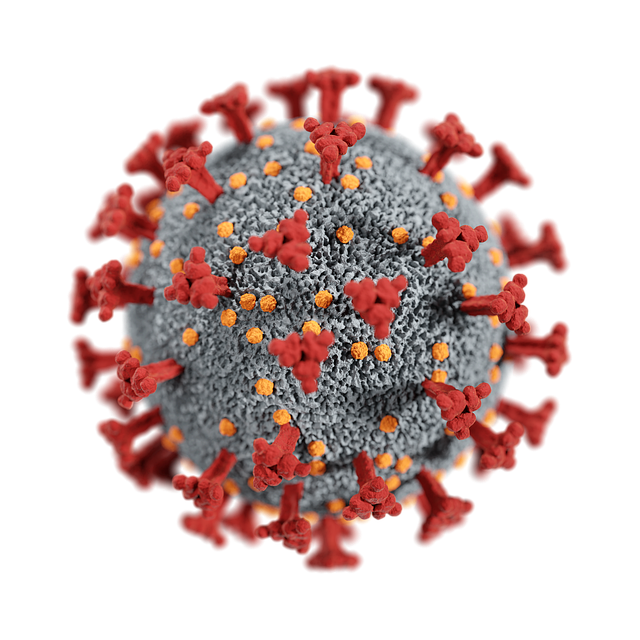
The Kaplan-Meier curve is constructed by recalculating the survival probability at each event time, accurately reflecting survival over time, for example for analyzing survival times of COVID-19 patients (Liu et. al, 2021).
 Image credit:
Pixabay
In clinical studies, the Kaplan-Meier estimate is often used to compare the efficacy of treatments by plotting the survival curves for different patient groups. To test the significance of the difference between these survival curves, the log-rank test is commonly used. The log-rank statistic is calculated as:
\[ \chi^2=\frac{\left[\sum_{i}\left(O_i-E_i\right)\right]^2}{\sum_{i} V_i} \]
where \( O_i \) is the observed number of events in the i-th group, \( E_i \) is the expected number of events under the null hypothesis, and \( V_i \) is the variance of the number of events.
The null hypothesis of the log-rank test is that there is no difference in the survival experience between the groups being compared. Specifically, it posits that the survival curves of the different groups are the same, meaning that the probability of the event (such as death or relapse) occurring at any given time point is the same across all groups.
In other words, under the null hypothesis, any observed differences in the survival curves are due to random variation rather than a true difference between the groups. If the log-rank test yields a p-value below a pre-specified significance level (e.g., 0.05), the null hypothesis is rejected, suggesting that there is a statistically significant difference in survival between the groups.
Collett, D. (2015). Modelling survival data in medical research (3rd ed.). CRC Press. https://doi.org/10.1201/b18348Liu X, Ahmad Z, Gemeay AM, Abdulrahman AT, Hafez EH, Khalil N (2021). Modeling the survival times of the COVID-19 patients with a new statistical model: A case study from China. PLoS ONE 16(7): e0254999. https://doi.org/10.1371/journal.pone.0254999
