
The multivariate chi-squared distribution is an extension of the univariate chi-squared distribution to multiple variables. It is often used in multivariate statistics, particularly in hypothesis testing and multivariate analysis. Examples include comparing covariance matrices across groups, testing models in multivariate regression, or assessing the goodness-of-fit for multidimensional data.
If \( \mathbf{Z}_1, \mathbf{Z}_2, \dots , \mathbf{Z}_\nu \) are independent and identically distributed Gaussian random vectors with correlation matrix \( R \), then the sum of their squares \( \mathbf{X} \) follows a multivariate chi-squared distribution.
The cumulative distribution function of the maximum of \( M \) dependent random variables \( X_1, X_2, \dots, X_M \) is:
\[ F_M(x) \equiv F_M(x, \nu, R) := P \left( \bigcap_{j=1}^M \{X_j \leq x\} \right) \]
where \( \mathbf{X} = (X_1, \dots, X_M)^\top \) and each \( X_j = \sum_{i=1}^{\nu} Z_{ij}^2 \) for \( j = 1, \dots, M \).
The multivariate chi-squared distribution does not have a simple closed-form expression for its distribution function. Its distribution function involves integrating over all possible values in a multidimensional space, which cannot be easily solved analytically.
Challenges and Computational Methods
Due to the complexities of the multivariate chi-squared distribution, practical calculations often rely on numerical methods or Monte Carlo simulations, especially in high-dimensional cases. Software packages like the R package mvtnorm do not directly support multivariate chi-squared distribution calculations, and SAS's PROC FREQ is limited to univariate and bivariate analyses without tools for multivariate chi-squared probabilities.
However, under certain assumptions, matrix factorization methods can be used to approximate multivariate chi-squared probabilities more efficiently "for (in principle) arbitrary dimension M and arbitrary degrees of freedom” (Stange et al., 2015). These computational methods are based on the idea that the correlation structure in the k-variate marginal distributions can be approximated using low-rank correlation matrices.
If “the underlying correlation matrix fulfills certain structural properties”(Kim et. al, 2023), the quantiles of the multivariate chi-squared distribution can be computed numerically. The main idea is to use low-rank factorization of the correlation matrices, reducing the problem to the computation of lower-dimensional marginal distributions, which is possible with standard computer programs.
Applications in Genetic Data
We developed MATLAB programs to implement these methods and demonstrated their accuracy and efficiency by comparing them to traditional approaches. Using real genetic data, we applied our computational methods to test for significant associations between genetic variations and specific phenotypes.
In genetic association studies, it is common to analyze many contingency tables simultaneously, each representing study data for a single position (locus) on the genome. Locus-specific chi-squared statistics often exhibit strong dependencies due to the biological mechanism of inheritance. These dependencies lead to low-rank correlation matrices, which meet the assumptions required for our computational methods under familywise error rate (FWER) control.

Multiple Hypothesis Testing
In large-scale genetic studies, testing multiple hypotheses increases the risk of false positives (Type I errors). Traditional multiple testing correction methods, like the Bonferroni correction or the False Discovery Rate (FDR), assume that all tests are independent, which is not the case in real-world data.
To account for dependence among tests, we calculate the effective number of tests, which adjusts for correlations. Instead of assuming that all tests are independent, it recognizes that correlated tests provide less new information than completely independent tests. By calculating the effective number of tests, we can adjust for the fact that some tests are not entirely new but share information with others.
A linkage disequilibrium (LD) matrix represents the pairwise correlation between genetic variants within a particular region of the genome. It quantifies how much the presence of one variant is non-randomly associated with another.
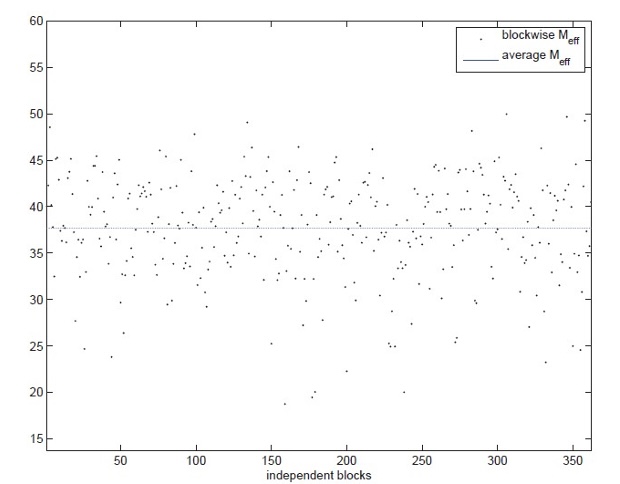
In (Stange et. al, 2015) we compute “an effective number of tests of order 3 based on LD information taken from the international HapMap project (http://hapmap.ncbi.nlm.nih.gov/). For exemplary purposes, we restrict our attention to loci on chromosome 21 in the CHD population (Chinese in Metropolitan Denver). In total this chromosome comprises M = 18,143 loci. We divided the chromosome into B = 363 blocks of size 50 each (notice the last of these blocks comprises only 43 loci). We consider ν = 2 degrees of freedom corresponding to (2 × 3) contingency tables (i.e. to diploid genotypes) and make the assumption that loci from different blocks lead to stochastically independent χ² test statistics. Under this assumption the effective number of tests can be calculated for every block separately, and the total effective number of tests is the sum of the block-specific ones.
For the entire chromosome we obtained an effective number of tests of order 3 [equal to] 13,676, meaning that effectively only approximately two-third of the M = 18,143 loci contribute to the calibration with respect to the FWER level [0.05].”
We showed through numerical experiments that our methods are faster and more efficient than traditional Monte Carlo simulations. The efficiency of our approach can be further improved with advanced techniques for matrix factorization, enhancing the accuracy of multivariate chi-squared probability calculations.
Eunseop Kim, Steven N. MacEachern & Mario Peruggia (2023) Empirical likelihood for the analysis of experimental designs, Journal of Nonparametric Statistics, 35:4, 709-732, DOI: 10.1080/10485252.2023.2206919
Stange, J. & Loginova, N. & Dickhaus, Thorsten. (2015). Computing and approximating multivariate chi-square probabilities. Journal of Statistical Computation and Simulation. 86. 1-15. 10.1080/00949655.2015.1058798.